


Your Elementor site looks great, but it takes four seconds to show anything on a phone, and Google Search Console says “Poor URLs.” That’s fixable, and on most WordPress sites it comes down to a short list of causes: oversized hero images, slow hosting, too much JavaScript, and elements that jump around as the page loads.
This guide shows how to measure your site, what to fix for each of the three Core Web Vitals on WordPress, and which Elementor and WordPress settings matter most. It also shows results from real client projects.
Quick answer: what “passing” Core Web Vitals means
A site passes when at least 75% of real visits hit the “good” threshold on all three metrics: Largest Contentful Paint (LCP) at 2.5 seconds or less, Interaction to Next Paint (INP) at 200 milliseconds or less, and Cumulative Layout Shift (CLS) at 0.1 or less. Google assesses mobile and desktop separately.
| Metric | What it measures | Good | Poor | Usual cause on Elementor sites |
|---|---|---|---|---|
| LCP | How fast the biggest visible element (usually the hero image or heading) loads | 2.5 s or less | Over 4 s | Heavy hero image, slow server, render-blocking CSS |
| INP | How quickly the page reacts after a tap, click, or keypress | 200 ms or less | Over 500 ms | Too much JavaScript, third-party scripts, sliders, animations |
| CLS | How much the layout shifts while loading | 0.1 or less | Over 0.25 | Images without dimensions, late-loading fonts, banners and embeds |
INP replaced First Input Delay (FID) in March 2024. FID only measured the delay before the first interaction. INP looks at every interaction during the visit, so it is harder to pass. Many older guides still list FID, so check the date before following any Core Web Vitals advice.
Step 1: Measure your real baseline first
Start with field data, which is what Google uses to judge your site, and use lab tests only to find causes. Field data comes from real Chrome users; lab data is a single simulated page load.
- Search Console, Core Web Vitals report. It groups your URLs into Good, Needs improvement, and Poor for mobile and desktop. Fix the largest group of Poor URLs first, because one template problem (like your blog post layout) often affects hundreds of pages.
- PageSpeed Insights. Enter a URL and read the “Discover what your real users are experiencing” section at the top. That is field data. The Lighthouse score underneath is lab data.
- Chrome DevTools. Use the Performance panel to see which scripts block interactions. This is how you find what is hurting INP.
Two things trip people up:
- Lighthouse cannot measure INP because it loads the page without a user clicking anything. It reports Total Blocking Time (TBT) instead, which is a useful stand-in. If TBT drops, INP usually improves, but confirm with field data.
- Low-traffic pages may show no field data. Test the page type (service page, blog post, homepage) on a similar high-traffic URL, or test with DevTools.
Field data in Search Console updates on a rolling 28-day window, so a fix will not turn Poor URLs green overnight. Record your baseline now, and check again in four weeks.
Test on mobile first. That is where most sites fail, and Google’s mobile-first indexing means the mobile result counts.
Real results: client sites moved from 40-60 to 92-98 on mobile
Across our WordPress and Elementor projects, client sites typically arrive with a mobile PageSpeed score between 40 and 60, and we take them to between 92 and 98. These live sites are among those we have optimized:
| Client site | Mobile PageSpeed score before | Mobile PageSpeed score after |
|---|---|---|
| siasdesign.com | 40-60 | 93+ |
| gallopsourcing.com | 40-60 | 98 |
| desertgatecapital.com | 40-60 | 96+ |
| neatledlighting.ca | 40-60 | 94 |
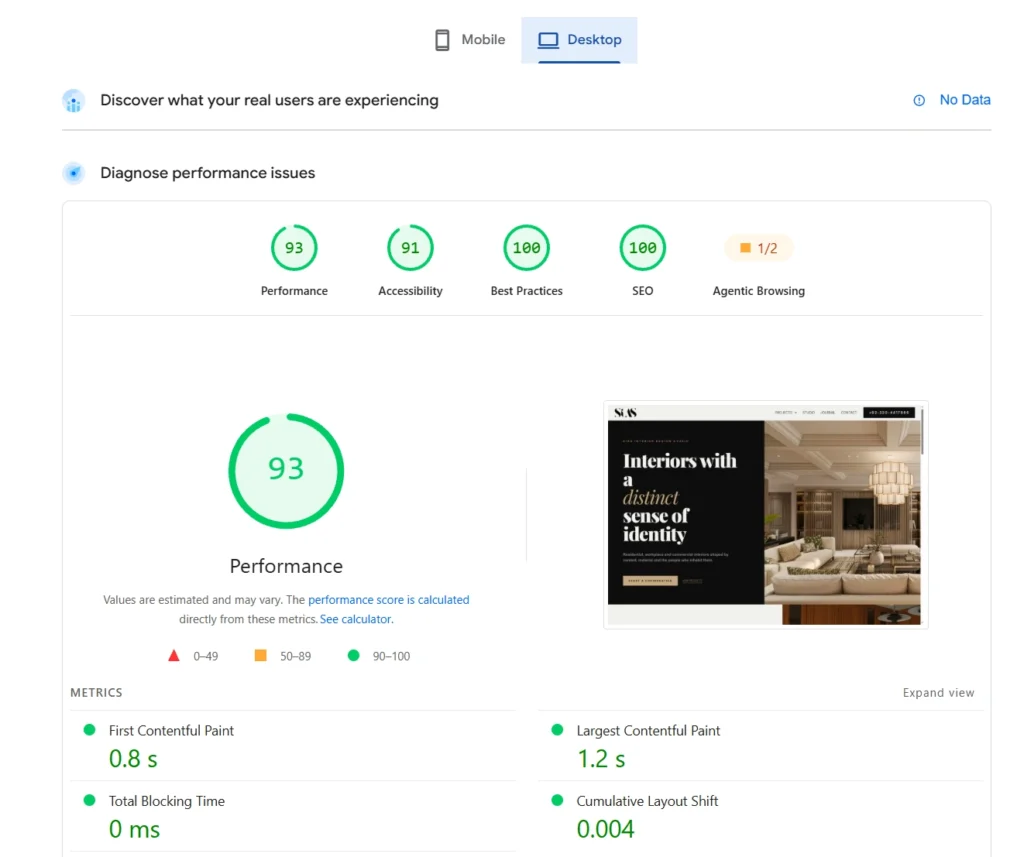
We also work with larger clients who prefer not to be named, and the pattern is the same. A mobile score of 90 or above is rated good on Google’s scale, so these sites finish in the green range. Google judges Core Web Vitals on real-user data, though, which is why we check the Search Console report 28 days after each project.
Results vary by site, so we record a baseline before the work starts and measure again afterward with the same tool, the same mobile setting, and the same page.
What we typically change, in order of impact:
- Compress and resize the hero image, convert it to WebP, and make sure it is not lazy-loaded.
- Add page caching and a CDN, and move off slow hosting when the server response time stays high.
- Delay chat widgets, analytics, and other non-essential scripts until the visitor’s first interaction.
- Set image dimensions, host fonts locally, and reserve space for banners and embeds to stop layout shifts.
Faster pages also keep more visitors on the site, which is why speed work pairs well with a conversion-focused design.
The rest of this guide explains each of those fixes so you can apply them to your own site.
Fix LCP: make the biggest element appear faster
On most Elementor sites, the LCP element is the hero image or the hero heading, so LCP problems come from four places: the server is slow, the image is heavy, the image loads late, or CSS blocks rendering. Check PageSpeed Insights for the “Largest Contentful Paint element” to see which element you are fixing.
1. Shrink and resize the hero image
- Export the image at the largest size it is actually displayed, not the original camera or stock photo size.
- Convert it to WebP (or AVIF). A hero that is several megabytes as a PNG is often under 200 KB as WebP with no visible loss. Our free image-to-WebP converter does this in the browser.
- Let WordPress serve responsive sizes by inserting the image through the Image widget or media library, not by pasting a fixed-size file.
2. Never lazy-load the hero image
Lazy loading tells the browser to wait on an image, which is right for images below the fold and wrong for the LCP element. Make sure the hero image is excluded from lazy loading in your caching or image plugin, and add a high fetch priority to it if your plugin offers that option. If the hero is an Elementor section background image set through CSS, the browser finds it late. Where you can, switch to an Image widget with the same design, or ask your caching plugin to preload that image.
3. Fix slow server response (TTFB)
If your Time to First Byte is above 0.8 seconds, no front-end fix will save LCP. Page caching is the biggest single win: it serves a saved HTML copy instead of rebuilding the page with PHP and the database on every visit. If TTFB stays high with caching on, the problem is usually cheap shared hosting. Moving to a managed WordPress host or a properly configured VPS often does more than any plugin.
4. Use a CDN for global visitors
A CDN serves images, CSS, and JavaScript from a location near the visitor. If your clients are in the US, Canada, and the UAE but your server is in one region, this matters for all three audiences.
5. Reduce render-blocking CSS and fonts
- Remove fonts and font weights you do not use. Each extra weight is another request.
- Host fonts locally instead of loading them from Google Fonts, and preload the one font used above the fold.
- Use your caching plugin’s option to load unused CSS only where needed. Test your key pages after turning it on, because aggressive CSS removal can break layouts.
Fix INP: make taps and clicks respond instantly
INP is poor when the browser is busy running JavaScript at the moment someone taps a menu, opens an accordion, or submits a form. The fix is almost always the same: run less JavaScript, and run it later.
1. Audit your plugins and third-party scripts
Open the Network tab or PageSpeed Insights and list every script that loads. Common offenders on WordPress sites are chat widgets, tag managers loaded with many tags, social feeds, heatmap tools, popup builders, and sliders. For each one, ask whether it earns its cost. Remove what you do not use, and deactivate plugins that load their code on every page when they are needed on one.
2. Delay non-essential JavaScript until the first interaction
Most caching and performance plugins can delay chosen scripts until the visitor scrolls, taps, or moves the mouse. This works well for analytics, chat widgets, and tracking pixels. Do not delay scripts your menu, forms, or cart depend on. Test the mobile menu and every form after changing these settings.
3. Slim down Elementor’s own weight
- Keep the DOM small. Deeply nested sections and columns create thousands of page elements, which makes every interaction slower. Lighthouse starts warning at around 800 elements. Where you can, rebuild old section and column layouts using Elementor’s Flexbox Containers, which need fewer wrapper elements.
- Cut entrance animations and motion effects. Scroll-triggered effects, parallax, and large animated backgrounds all run JavaScript on interaction. Keep animation for one or two key places, and do not use it on mobile.
- Replace heavy sliders and carousels with a static image or a simple grid. A rotating hero slider is also bad for LCP.
4. Find the slow interaction before guessing
In Chrome DevTools, open the Performance panel, record while you tap the slow element, and look for long tasks (red-flagged blocks) in the main thread. The script name in that task tells you which plugin or widget to fix. Google’s free Web Vitals extension for Chrome also shows INP live as you click around a page.
5. Check your TBT as a lab proxy
If Total Blocking Time falls after your changes, INP in the field usually follows. Remember that field data lags by up to 28 days, so give it time before judging the result.
Fix CLS: stop the page from jumping
Layout shift happens when something loads late and pushes content that is already on screen. Visitors feel it as a button moving just as they tap it. Fix it by reserving space for everything that loads after the first paint.
1. Give every image a width and height
Without dimensions, the browser does not know how much room an image needs until it downloads. WordPress adds width and height attributes automatically to images inserted from the media library, but images added through custom code, some page builders’ background settings, and old imported content may miss them. Check any image that appears in the shift list in PageSpeed Insights.
2. Stop fonts from reflowing the text
When a custom font loads after the fallback font is shown, the text changes size and everything below moves. Reduce this by hosting your fonts locally, preloading the main font, using font-display swap, and choosing a fallback font with similar proportions. Fewer font weights also means fewer swaps.
3. Reserve space for banners, embeds, and ads
- Cookie banners and announcement bars: show them as an overlay fixed to the bottom or top of the screen, not as a block that pushes the page down after load.
- YouTube, maps and social embeds: put them in a container with a fixed aspect ratio so the space exists before the embed loads.
- Late-loading widgets: give them a minimum height in the layout.
4. Watch Elementor sticky headers and popups
A header that changes height when you scroll, or a popup that inserts itself into the page flow, causes shifts. Set a fixed header height, use transform-based animation instead of animating height or margin, and trigger popups as overlays.
5. Find the exact shifting element
In PageSpeed Insights, open the diagnostics for “Avoid large layout shifts” to see which elements moved. In Chrome DevTools, the Performance panel marks layout shifts on the timeline, so you can click each one and see what moved.
Elementor and WordPress speed checklist
Work through this list in order. Take a PageSpeed Insights screenshot before you start, and after each major change, so you know which fix actually helped. Setting names vary between Elementor versions, so look in Elementor’s Settings, Features, and Experiments areas for the closest match.
Hosting and caching
- Hosting returns a TTFB under 0.8 seconds on uncached and cached pages
- One page caching plugin is active (not two)
- CDN is enabled for images, CSS, and JavaScript
- PHP is on a current supported version
Images and fonts
- Hero image is WebP, correctly sized, and excluded from lazy loading
- All below-the-fold images are lazy loaded
- Fonts are hosted locally with unused weights removed
- Every image has width and height attributes
Elementor settings
- Inline SVG icons are on, so Font Awesome and eicons files are not loaded for every page
- Elementor’s optimized loading features for images, CSS, and assets are turned on where your version offers them
- Old section and column layouts are being replaced with Flexbox Containers on key pages
- Animations and motion effects are removed or limited on mobile
Scripts and plugins
- Unused plugins are deactivated and deleted
- Chat widgets, analytics, and pixels are delayed until first interaction
- No rotating hero slider above the fold
- Cookie banner and popups do not push content down
A simple plugin stack
You do not need many plugins, and more plugins usually means a slower site. A sensible setup is one caching and optimization plugin (WP Rocket, FlyingPress, or LiteSpeed Cache if your host runs LiteSpeed), one image optimization plugin (ShortPixel, Imagify, or EWWW), and a script manager such as Perfmatters or Asset CleanUp to stop plugins loading on pages that do not need them. Pick tools your host supports, and test each setting on a staging copy before it goes live.
Speed also supports the rest of your site’s performance. Fast, stable pages help responsive web design work on every device, lift conversions as covered in our high-converting website UX guide, and complement the on-page SEO steps that help you rank.
Common mistakes that keep Elementor sites failing
- Chasing the lab score instead of field data. A 95 in Lighthouse does not mean you pass Core Web Vitals. Judge success by Search Console and the real-user section of PageSpeed Insights.
- Installing several caching or optimization plugins. They conflict, and the result is often slower and buggier than one well-configured plugin.
- Lazy loading everything, including the hero image. This directly hurts LCP.
- Turning on aggressive JavaScript delay and not testing. A delayed menu script means a mobile menu that does not open, which is worse than a slow score.
- Optimizing one page. Core Web Vitals problems usually come from templates, so fix the header, footer, and blog layout first.
- Expecting instant results. Field data moves on a 28-day window.
Frequently asked questions
Is Elementor bad for Core Web Vitals?
Elementor adds some CSS, JavaScript, and page elements compared with hand-coded pages, but a well-configured Elementor site can pass. In practice, hosting, oversized images, and third-party scripts cause more failures than Elementor itself.
What is INP and why did it replace FID?
Interaction to Next Paint measures how quickly the page responds to taps, clicks, and key presses throughout a visit. First Input Delay only measured the first interaction, so Google replaced it with INP as a Core Web Vital in March 2024.
What is a good PageSpeed score?
The Lighthouse score is a lab estimate. A score of 90 or higher is rated good, but passing Core Web Vitals depends on real-user LCP, INP, and CLS, not on the score alone.
Do Core Web Vitals affect Google rankings?
They are part of Google’s page experience signals, but relevance and content quality still matter most. Treat speed as a way to stop losing visitors and to remove a ranking disadvantage, not as a shortcut to page one.
How long until Search Console shows my improvements?
The Core Web Vitals report uses a rolling 28-day window of real-user data. Expect to wait about four weeks after your fixes before the report fully reflects them.
Can I fix this myself without a developer?
Image compression, caching, removing unused plugins, and delaying scripts are all doable for a confident site owner. Server migrations, rebuilding layouts with Flexbox Containers, and tracking down slow scripts in DevTools usually need a developer.
Conclusion: fix the biggest problem first
Start with your Search Console report, find the metric that is failing, and fix the cause behind it: heavy images and slow hosting for LCP, too much JavaScript for INP, and unreserved space for CLS. Make one change at a time, measure it, and give the field data four weeks to update.
If your Elementor or WordPress site is failing Core Web Vitals and you would rather have it handled, FuturePeak Digital builds and optimizes fast, mobile-first websites. Book a free strategy call, and we will review your current scores and tell you what to fix first.
Sources
- Web Vitals, web.dev (Google): metric definitions, thresholds, the 75th percentile rule, and INP replacing FID.